OrderFlowViz.com
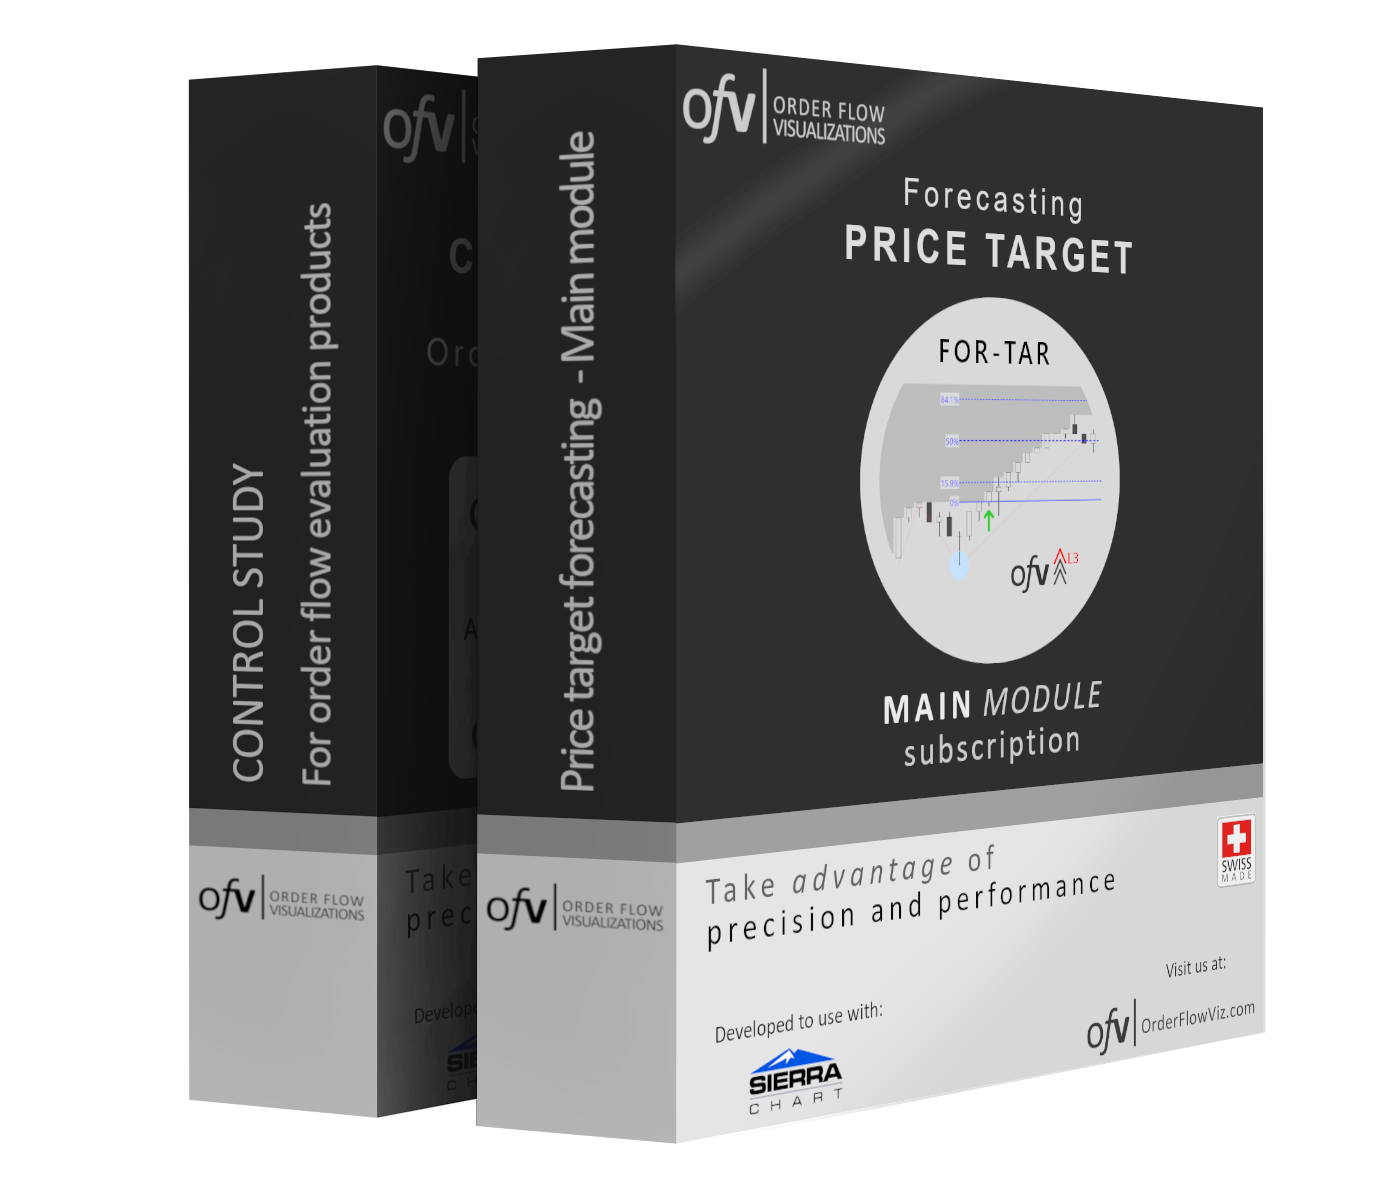
Price target forecasting - Main module
Price target forecasting - Main module
The Account Name / Username can be found in Sierra Chart from the menu "Help" -> "About". Enter it here before adding the product to the cart.
Couldn't load pickup availability
Product information:
Only available for the Sierra Chart trading and charting platform.
You will subscribe to the product "Price target forecasting - Main module" as per your selection of the subscription plans available.
The product consists of the following software components:
- FOR Price target module
- Control study
The product needs to be set to a signal output of a reference study. Upon appearance of a signal, the study calculates all price moves that happened in the past when the same signal appeared. It will then visualize the average price target directly on the chart.
Furthermore, it will show the price targets for the first standard deviation above the and below the average price target. In a long setup this could be expressed as the probabilities that price turns around before the lower SD is 16%, that it reaches at least the average is 50% and price going to or above the upper SD is 84%.
This can be visualized for 3 rotations (in a long setup 1 up wave and 1 down wave per rotation) after a signal. Hence, you can immediately judge if a setup is good. For instance we would judge it as good if the first wave goes far in average with narrow SD, then the retracing wave should be shallow, also with low probability to reach our entry level. The next move should again be further and so on. It will always be the case, that the target zones defined by these standard deviations will widen up. This will give you good judgment at what point the effects of your setup start to dissipate.
Of course, every occurrence that has been calculated remains in the chart. You can also track it back and gain insights how things developed over time. Each visualized occurrence carries a sequential number. This way you always know your current sample size.
It is possible to make these calculations backwards for a quarter million bars. At such large numbers the calculation durations are around 20ms on a decent PC-System. Running multiple systems in parallel is therefore no problem.
Item: 76-FOR-TAR-31 / Short name: FOR Price target module
Requirements:
- Sierra Chart trading platform
- Level 1 tick by tick data
- Time stamps on each bar for bar start time
- A signal generator that outputs a signal at the end of an up or down wave (use an OrderFlowViz.com product for best compatibility)
Also refer to the documentation "Requirements checks".
Price information:
- Subscription only (advance payment for each subscription period)
- No one-time / no lifetime purchase option
- Subscription renewal payments are due on the same day of the month as the initial payment
- Validity starts at the moment of delivery
- Validity ends at the day of the month where delivery took place, plus 10 days (grace period), plus the amount of months of the subscription period
- Regular price is the monthly price in CHF of the 6 monthly subscription
- Optionally there are 3-monthly and monthly subscriptions available (at increased monthly prices)
- There are no free trial periods available (select a one month subscription period for testing user specific setups)
Our refund policy remains in effect, please review at check-out.
Should you have any further questions on the product, please get in touch with us!


