OrderFlowViz.com
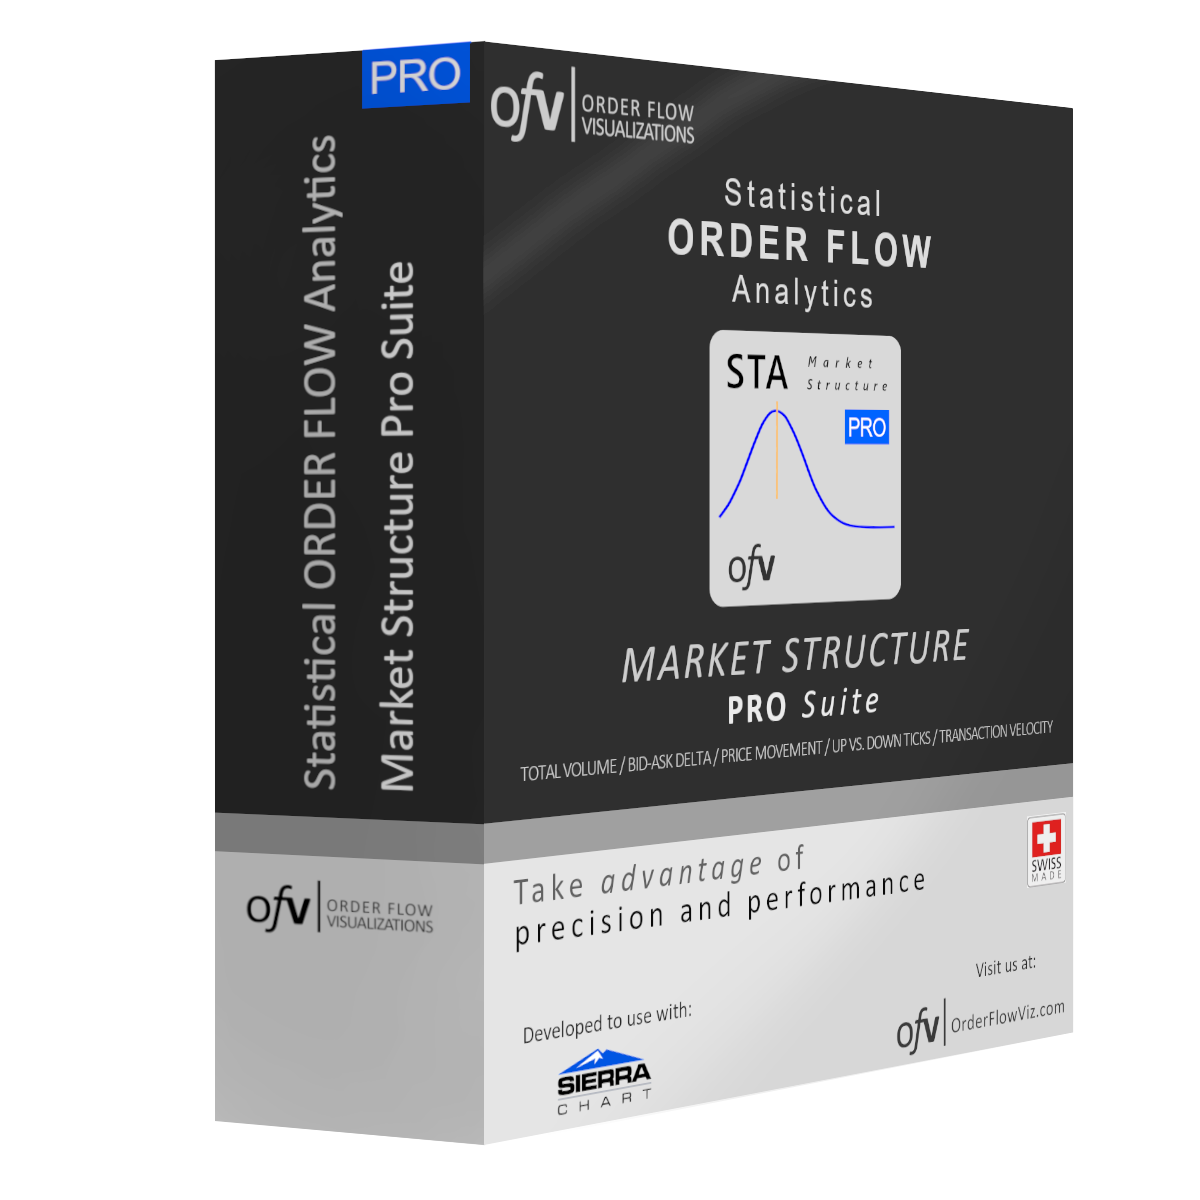
Statistical Order Flow Analytics - Market Structure Professional Suite
Statistical Order Flow Analytics - Market Structure Professional Suite
The Account Name / Username can be found in Sierra Chart from the menu "Help" -> "About". Enter it here before adding the product to the cart.
Couldn't load pickup availability
Market Structure PRO Suite
Stop guessing. Start measuring.
Most traders watch price and volume. You'll analyze 500,000+ bars of order flow data to know if what's happening is normal or opportunity.
The Market Structure PRO Suite gives you institutional-grade statistical analytics for Sierra Chart—analyzing every market move against half a million bars of historical context in real-time.
What You Get: 5 Statistical Analytics Modules
Each module transforms raw order flow data into actionable Z-scores, showing you when market behavior deviates from statistical norms:
- Total Volume Analytics – Is this volume surge normal or extreme for this market move?
- Bid-Ask Delta Analytics – Is buying/selling pressure statistically significant?
- Price Movement Analytics – How does price range compare to historical averages?
- Up vs. Down Ticks Analytics – What's the trade count distribution telling you?
- Transaction Velocity Analytics – Is order flow accelerating or decelerating?
Each module prints a normalized standard line alongside the statistical data, making it easy to compare current market behavior against historical norms at a glance.
Plus: Control study and probability zone visualization backgrounds included.
How It Works: Real-Time Statistical Context
The suite calculates and analyzes up to 524,000 chart bars, applying this analysis to every market move (up or down) on a unified Z-score scale.
Bar-by-bar data printing: As each move develops, data prints in real-time—allowing you to compare volume, delta, price movement, bar duration, and trade quantities against a statistical standard line.
No repainting: Once printed, studies never change. Perfect for backtesting, historical analysis, and systematic decision-making.
Algorithmic precision: PRO versions include advanced distribution analysis options and algorithm adjustments for improved accuracy.
Use Cases: Systematic Edge
Statistical thresholds for decision-making:
Trigger actions when delta reaches +1 standard deviation from the mean while price range remains -0.5 standard deviations below the mean. Build rules. Generate alerts. Automate signals.
Compare metrics against each other:
See when volume is extreme but price movement is compressed. Identify divergences. Spot institutional absorption or distribution.
Define your own edge:
Analyze all bars in the chart (up to 524,000) or focus on recent moves. Adjust reversal conditions. Customize thresholds. Build systematic strategies based on statistical probability, not gut feeling.
Requirements
This product works exclusively with the Sierra Chart trading platform and requires:
- Level 1 tick-by-tick data feed
- Time stamps on each bar (bar start time required)
- Bar ending time tick-by-tick (recommended for best experience)
- OHLC price information (tick-by-tick on close/last price recommended)
- Bid, Ask, number of trades, and total volume on each bar (tick-by-tick recommended)
Refer to the "Requirements Checks" section in our documentation for detailed setup guidance.
Delivery & Installation
You'll receive your studies by email or download them from our website. Installation is simple:
- Save the files to your Sierra Chart data folder
- Select the studies in the "Studies" settings for your chart
- Start analyzing with institutional-grade statistical context
Updates are included for all active subscriptions.
For detailed setup and usage, refer to the documentation and resources available on OrderFlowViz.com.
Subscription Information
Pricing:
- Regular price: CHF 149/month (6-month subscription)
- 3-month and monthly subscriptions available at increased monthly rates
- Subscription-only (no one-time or lifetime purchase option)
Validity:
- Advance payment for each subscription period
- Validity starts at moment of delivery
- Validity ends on delivery day of month, plus 10-day grace period, plus subscription months
- Renewal payments due on same day of month as initial payment
Trial Period:
- No free trials available
- For testing user-specific setups, select a one-month subscription period
Our refund policy remains in effect—please review at checkout.
Important: Sierra Chart Account Verification
For verification purposes, you'll need to provide your Sierra Chart Account Name during checkout. The mandatory field behaves like a password field in some browsers, but do not provide your Sierra Chart password—only your account name.
Product Code: 76-STA-MST-11 | Short Name: Market Structure PRO Suite
Questions about this product? Get in touch with us.